In-Game Advertising Measurement: From Exposure to Outcomes
·17 min read
A defensible measurement architecture for turning Roblox analytics, Fortnite engagement signals and brand-lift evidence into decisions without pretending visits equal impact.
By Tu Dang · Founder of ROLearn
· 15 min read · Updated

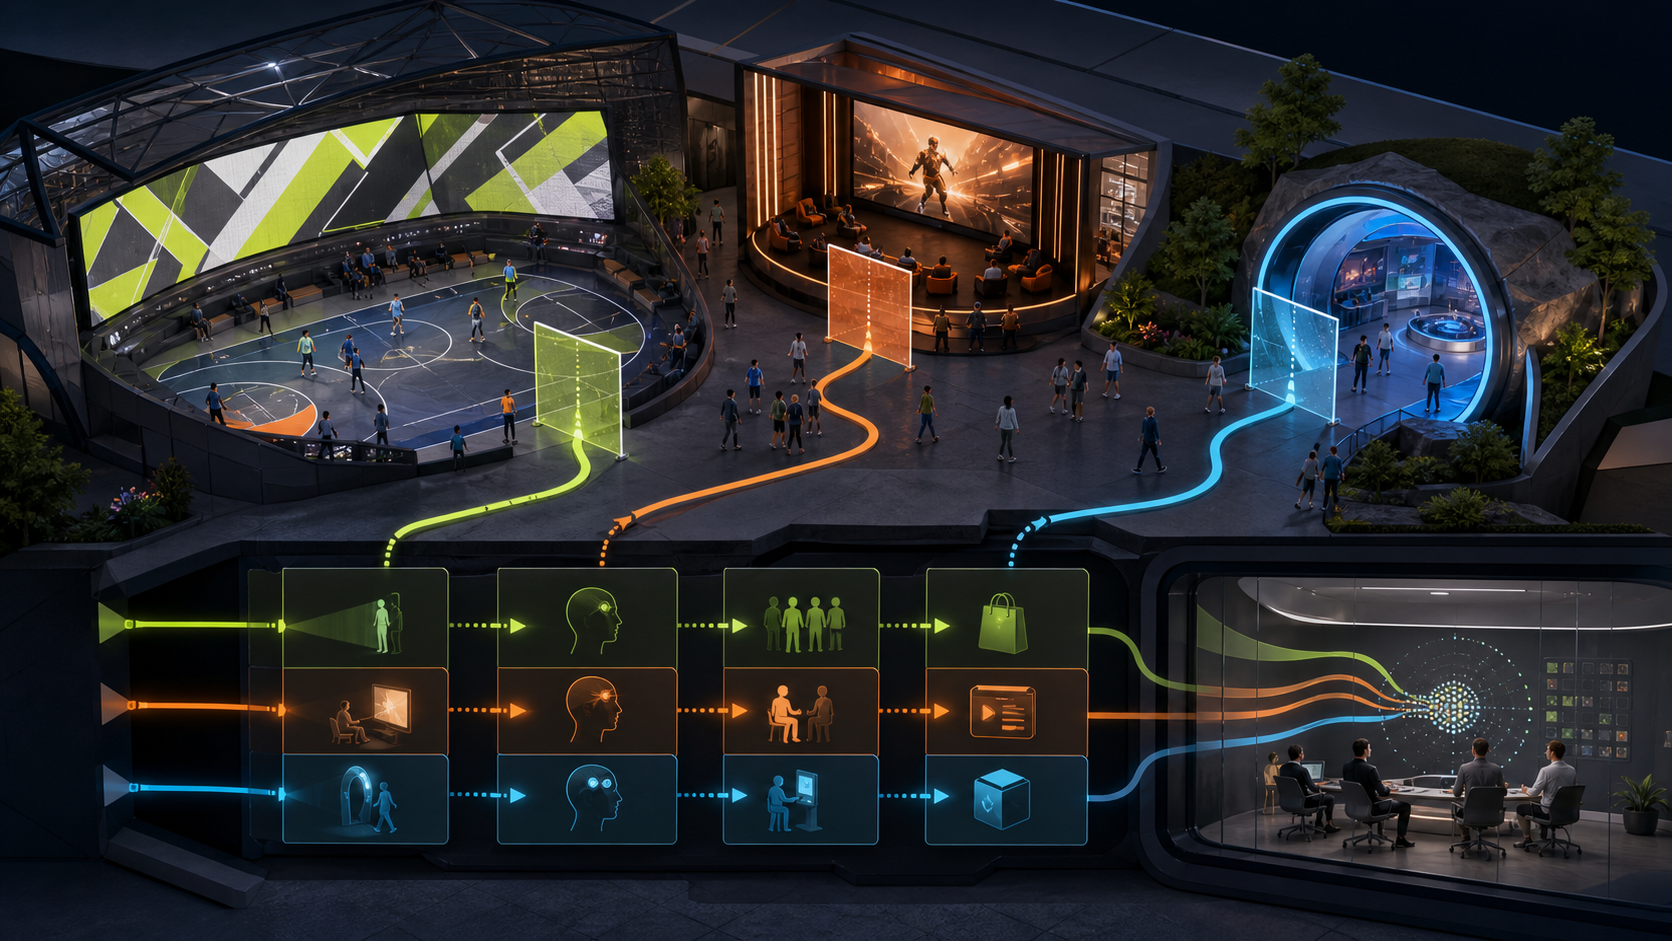
A launch report arrives with a large visit count, a healthy average session and a wall of social screenshots. The dashboard is positive. The harder questions remain unanswered. How many people were genuinely present? How much of their time occurred near the brand? What did they choose to do? Did the activation change memory or behaviour? Did any of that create incremental business value?
Those are not different names for the same outcome. They are different layers of evidence. Collapsing them into a single engagement score makes a report easier to present and harder to believe.
This report sets out a practical brand activation measurement architecture for Roblox, Fortnite and other virtual worlds. It synthesises primary industry standards with current platform analytics documentation. It does not claim that attention can be read directly from a server log. It shows what telemetry can establish, what requires research outside the platform, and where a marketer should report uncertainty.
Traffic tells you that a player crossed the threshold. Attention begins only after you establish that the player was present and the brand had an opportunity to be perceived.
Traffic metrics answer an important acquisition question: did distribution persuade someone to enter? Roblox acquisition analytics can help creators understand where new users came from, while Fortnite Discover documentation explains how attraction and engagement signals inform visibility. Those systems are useful for operating an experience. Neither turns a join into evidence of brand impact.
A raw visit can contain:
Reporting all six events as equivalent visits discards the distinction a media buyer actually needs. The correct move is not to delete traffic. It is to keep it at the first layer and prevent it from impersonating the layers above.
The IAB gaming framework separates delivery and exposure questions from business outcomes. The IAB, MRC and CIMM attention framework treats attention as its own measurement category rather than a synonym for viewability. The WFA Halo framework adds a cross-media principle that matters here: reach should be deduplicated before channels are combined.
Applied to a virtual-world activation, those ideas produce five layers.
| Layer | Question | Best-fit evidence | What it cannot prove alone |
|---|---|---|---|
| Qualified reach | Who arrived and passed the validity rule? | Session starts, unique accounts, acquisition source | That the player noticed the brand |
| Active attention | Was the player actively present near a perceptible brand context? | Foreground state, input cadence, camera or zone state, active seconds | Memory, persuasion or positive sentiment |
| Engagement | What did the player choose to do? | Quest events, item use, completion depth, return cohorts | That the action changed brand preference |
| Brand impact | Did exposure change what people know, feel or intend? | Exposed-control survey, brand-lift study, tested recall | Incremental revenue without further design |
| Business value | Did the activation change a commercial or strategic outcome? | Experiments, matched markets, conversions, revenue, qualified leads | That every observed outcome was caused by the activation |
The architecture is deliberately inconvenient. A campaign can have high reach and weak attention, deep engagement among a small niche, strong brand lift without immediate conversion, or commercial value that appears after the reporting window. A single score hides those paths. A layered report shows them.
The first technical task is session hygiene. Decide before launch which events count as a usable session and which must be excluded or flagged. Common rules cover minimum loaded time, successful spawn, duplicate joins, suspected automation, background state, disconnections and extreme outliers.
The rule should fit the experience. A 20-second branded portal and a 15-minute quest cannot share a minimum session threshold without distorting one of them. The threshold should therefore be declared, versioned and tested against the intended player journey.
Next, deduplicate to the level the data permits. Account-level unique reach is not necessarily person-level reach. Shared devices, multiple accounts and cross-platform exposure all complicate the count. If identity cannot be reconciled safely, report account reach and state the limitation instead of relabelling it as people.
Elapsed session time begins when a session starts and ends when it stops. Active time asks whether the player continued to provide evidence of presence during that interval.
Useful signals may include movement, camera change, menu use, interaction events, progress events and the application remaining in the foreground. None is conclusive alone. A player may read a sign without moving; a scripted animation may create events without attention. The implementation therefore needs a documented inactivity policy and a grace period appropriate to the mechanic.
Roblox retention and engagement analytics are valuable diagnostic inputs because they help teams understand session behaviour and return cohorts. Fortnite engagement metrics likewise support operating and discovery decisions. For brand measurement, these platform metrics become stronger when event instrumentation identifies where active time happened and which branded objects or mechanics were available to perceive.
Qualified attention hours=Sum of valid active branded-context seconds / 3,600
This is an auditable unit definition, not a claim that every active second produced equal cognitive attention.
Total active playtime belongs to the experience. Only a subset can reasonably belong to the brand. That subset is branded-context attention.
The measurement plan should define eligible zones, objects, audio, interfaces or mechanics before data is collected. Depending on the design, qualification may consider whether the object was rendered, within a plausible field of view, large enough to be perceived, audible, or required for progress. The policy should also cap repeated exposure so one idle or highly repetitive player does not dominate the total.
This is where in-game advertising measurement differs from ordinary session analytics. A long Roblox session can be excellent evidence for game health and weak evidence for a particular brand placement. Conversely, a short but deliberate product interaction may provide more relevant attention than several minutes elsewhere in the world.
Engagement should represent a choice with interpretable meaning. Opening a branded area, trying a virtual item, completing a quest, sharing an artefact or returning for a content update can all be useful. A generic click count cannot tell a decision-maker whether the action was accidental, required, repeated or valuable.
An event taxonomy should record at least:
Completion depth often says more than total starts. Return behaviour says something different again. A studio may use day-one and later cohort retention to diagnose whether the game earns another session. A brand team should avoid calling that retention “loyalty” without research that connects the return to the brand.
Server logs observe behaviour inside the instrumented environment. They do not observe unaided awareness, recall, favourability or purchase intent. Those outcomes require people-level research, usually a survey or another validated brand-lift design.
The quality of a lift result depends on how exposed and comparison groups were constructed, whether the survey reached both groups consistently, whether the sample is large enough for the reported cut, and whether material differences existed before exposure. Random assignment is strongest when feasible. Matched controls and statistical adjustment can be useful, but the remaining assumptions must be visible.
Roblox’s announced work with Ipsos and EDO is evidence that immersive campaigns are moving toward recognised third-party measurement. It is not permission to assume that every campaign generated lift. Each activation still needs its own design, sample and result.
| Claim | Minimum evidence | Stronger evidence | Reporting language |
|---|---|---|---|
| Players were exposed | Instrumented opportunity to see or hear | Validated view or context rule | Qualified exposure |
| Players remembered the brand | Post-exposure recall measure | Exposed-control lift with quality checks | Measured recall lift |
| Players preferred the brand | Favourability or consideration measure | Pre-declared lift design with controls | Measured change in stated preference |
| The activation drove action | Attributed conversion event | Randomised test or credible matched counterfactual | Incremental action or modelled attribution |
| The activation created value | Defined outcome and valuation rule | Incremental profit or another audited business measure | Business impact under the stated method |
Business value may include incremental sales, qualified leads, product trials, membership, licensing demand, creator adoption, research learning or reusable virtual assets. The correct outcome depends on the brief.
The Media Rating Council’s outcomes standards emphasise data quality and the relationship between exposure and outcome measurement. That relationship is crucial in virtual worlds because the commercial event may occur off-platform, later, on another device, or through a retailer that cannot share person-level data.
Use the strongest causal design available. If a randomised holdout is impossible, consider matched markets, staggered rollout, time-series controls or a clearly labelled attribution model. If none is credible, report the observed outcome as correlated rather than incremental.
Once active branded-context time is defined, a team can divide eligible campaign cost by qualified attention hours. The result helps compare creative versions, placements or scenarios that use the same governance rules.
Cost per qualified attention hour=Eligible campaign cost / qualified attention hours
Declare which production, media, creator and operating costs are included. Do not compare outputs built with different attention rules.
This is more informative than cost per visit when attention depth is the decision. It is not a universal media currency. An hour in an interactive world is not automatically equivalent to an hour of video, audio or social attention. Audience relevance, creative context, brand safety, geography and the measured outcome still matter.
The metric is best used within a campaign or a governed portfolio. Cross-channel media value requires a broader architecture that handles native channel units, overlap and market comparables. That is the role of ROLearn’s OMNI-EMV framework, not of attention time alone.
Consider a fictional global Roblox brand activation. The numbers below demonstrate the calculation path. They are not a benchmark, forecast or result from a real campaign.
| Step | Illustrative input | Calculation | Output |
|---|---|---|---|
| Traffic | 1,000,000 recorded joins | Remove failed loads, invalid activity and duplicate accounts under the declared policy | 720,000 qualified accounts |
| Active attention | Qualified sessions with foreground and presence signals | Sum active seconds after inactivity rules | 75,000 to 92,000 active hours |
| Branded context | Eligible zone, object and mechanic states | Apply a 28% to 38% context share under tested rules | 21,000 to 35,000 qualified attention hours |
| Engagement | 190,000 accounts completed a meaningful branded action | Deduplicate and cap repeatable events | 26% of qualified accounts |
| Efficiency | $1.47 million eligible campaign cost | Divide by qualified attention hours | $42 to $70 per qualified attention hour |
The correct conclusion is not “the activation delivered $42 attention.” It is:
If a survey later found a credible exposed-control recall lift, it would sit beside these figures. If sales data could support an incrementality test, that result would sit in the business-value layer. Neither should be reverse-engineered from session telemetry.
A range is useful only when the inputs and the reason for uncertainty are visible. Start with a coverage table:
Then vary the inputs that can materially change the decision. In the illustrative example, the attention range reflects uncertainty in active-time validation and branded-context share. A real model may also vary identity resolution, missing events, survey non-response and cost allocation.
Confidence is not a decorative grade added after the number. It is the accumulated quality of the evidence beneath it.
An executive report should fit on one page without collapsing the architecture. Show one primary metric per layer, the trend or comparison that makes it interpretable, and a short data-quality note.
| Layer | Primary view | Required companion | Decision supported |
|---|---|---|---|
| Qualified reach | Deduplicated qualified accounts | Acquisition mix and validity exclusions | Was distribution efficient? |
| Active attention | Qualified branded-context hours | Median depth and coverage range | Did the experience earn usable attention? |
| Engagement | Meaningful-action rate | Funnel depth and repeat cap | Which mechanic created participation? |
| Brand impact | Lift with interval | Sample, control design and field dates | Did exposure change perception? |
| Business value | Incremental outcome where available | Attribution design and profit basis | Should the investment continue or change? |
Keep the diagnostic appendix behind that page: cohort retention, device and geography cuts, creator distribution, press coverage, event funnels and data-quality logs. Senior readers need the decision; analysts need the route back to the evidence.
Use it before the brief is final. Decide which brand and business outcomes matter, then ensure the experience, analytics implementation, research sample and reporting window can observe them. Instrumentation added after launch rarely reconstructs the missing exposure context.
Use it to compare creative choices. If two worlds deliver similar qualified reach but one produces more active branded-context time and deeper voluntary interaction, the framework explains why.
Use it to commission partners. Ask a Roblox marketing agency, game studio or measurement vendor for event definitions, deduplication policy, idle rules, survey design, coverage and limitations before accepting a headline number.
Use it to improve the next activation. The most valuable output may be a finding about onboarding, quest depth, creator distribution or post-launch content rather than a single valuation.
Do not call all session time attention. Do not call all clicks engagement. Do not call observed conversion incremental sales. Do not compare platforms using different definitions without normalising the rules. Do not use a point estimate when missing data could change the budget decision.
Most importantly, do not turn the five layers into a black-box score. A composite can help rank campaigns after governance is established, but the underlying evidence must remain visible. When a score rises, the team should be able to say whether reach, attention, engagement, brand impact or business value moved and why.
Ten primary standards, platform documentation pages and first-party measurement releases.
Structured mapping of metrics to questions, observable events, evidence limits and decision uses.
Fictional arithmetic used only to demonstrate the measurement path; it is not a benchmark.
The report defines an architecture, not universal thresholds, media rates or causal coefficients.
Updated 12 August 2026. This edition replaces the original scaffold and contains no invented campaign claim.
If a partner cannot answer these questions before launch, the post-campaign report will probably be forced to substitute traffic for evidence.
Tu Dang. "Measuring Attention, Not Traffic in Virtual Worlds." ROLearn Intelligence, July 18, 2026. https://intelligence.rolearn.dev/reports/measuring-attention-not-traffic

Tu Dang
Founder of ROLearn
I study how games become businesses, media channels, and virtual economies.
View author profile →One decisive insight on games, brands, and virtual worlds, every Thursday.
Tu Dang
Founder of ROLearn
I study how games become businesses, media channels, and virtual economies.
One decisive insight on games, brands, and virtual worlds, every Thursday.